Analytics - Microsoft
Microsoft Power BI is an interactive data visualization application that can be used to build reports and dashboards using data concepts available via the Bulk Data API.
Getting Started (Connecting via Redshift)
To get started, follow these steps:
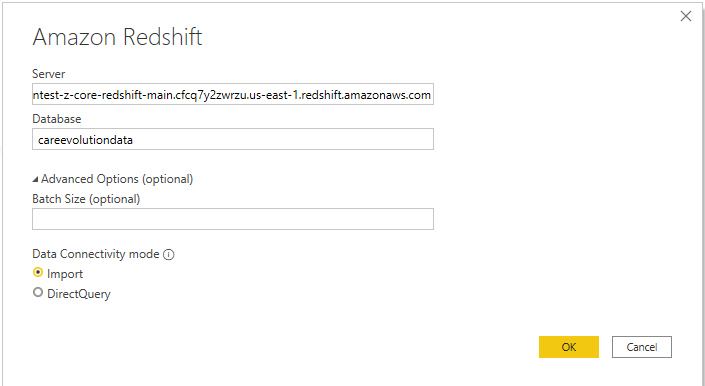
Step 1: Connect to Redshift
Open Power BI Desktop. Select “Get Data”, then choose “Amazon Redshift”.
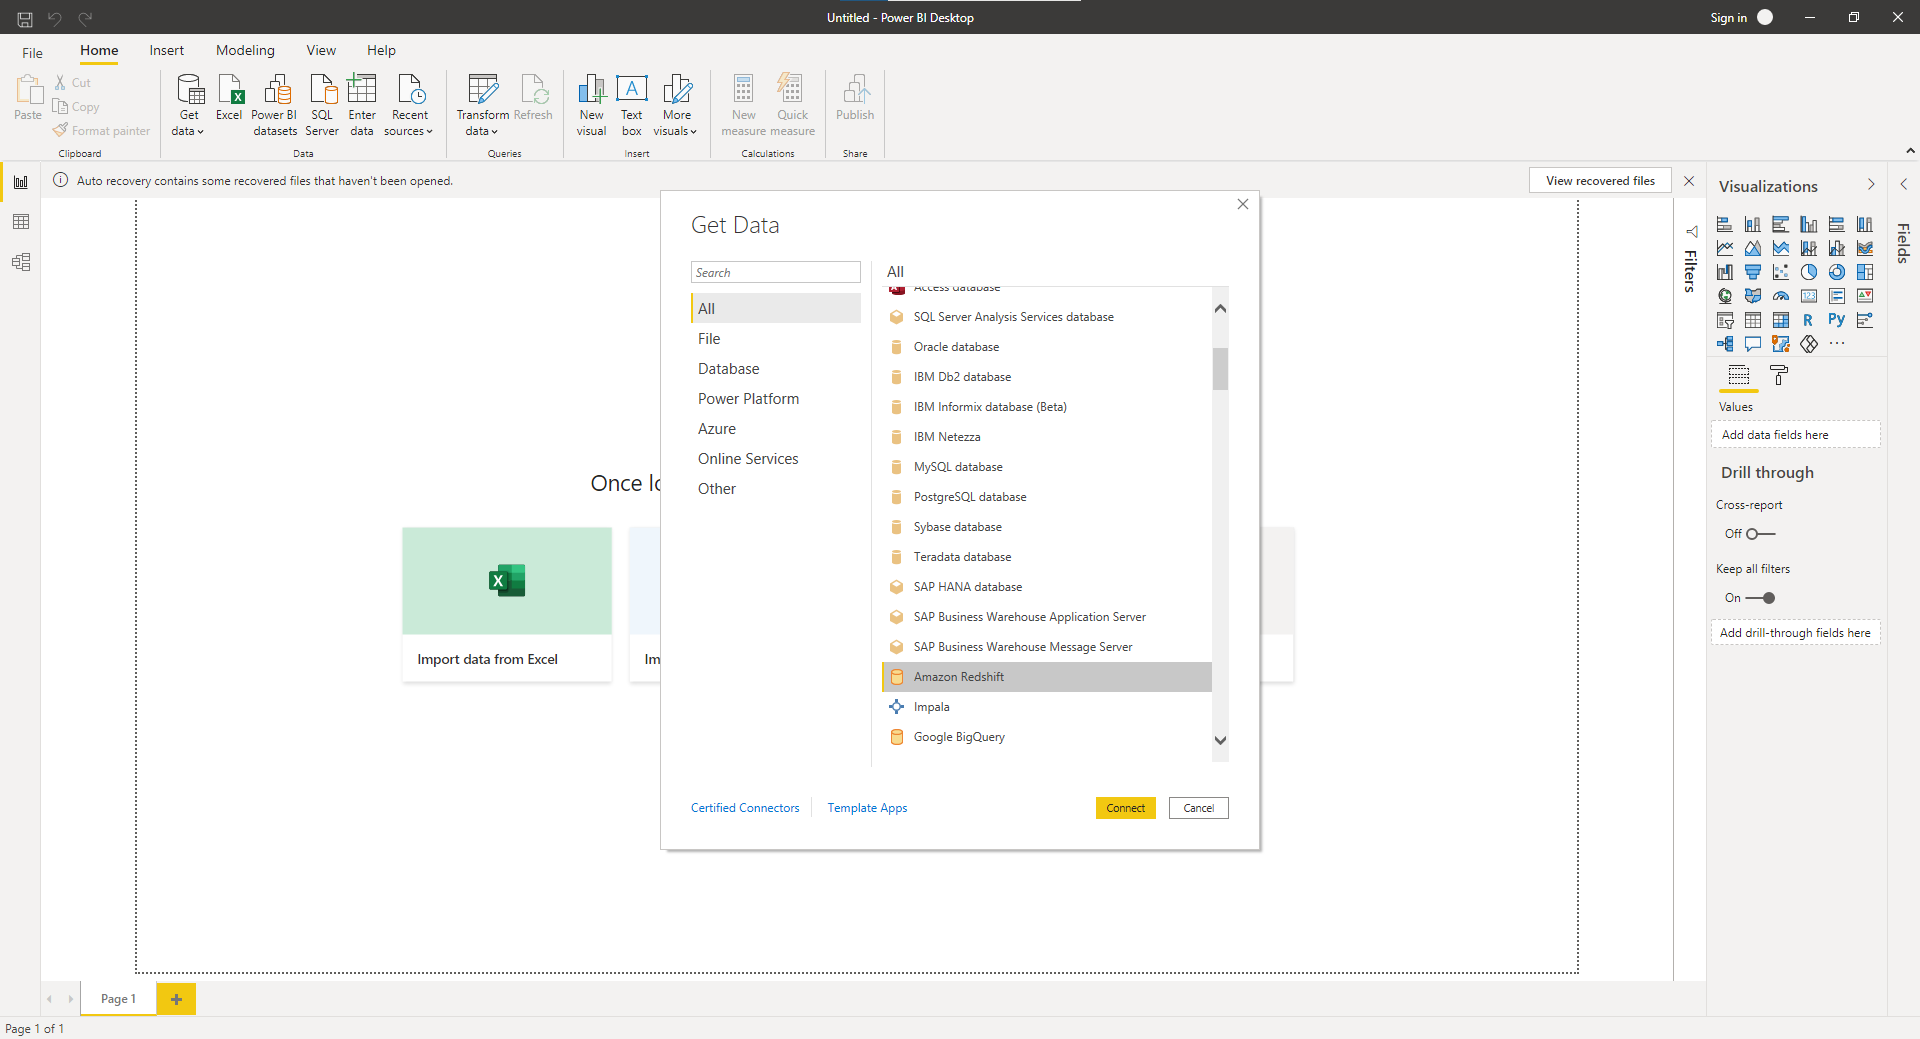
Enter Server and Database. Choose Data Connectivity mode.
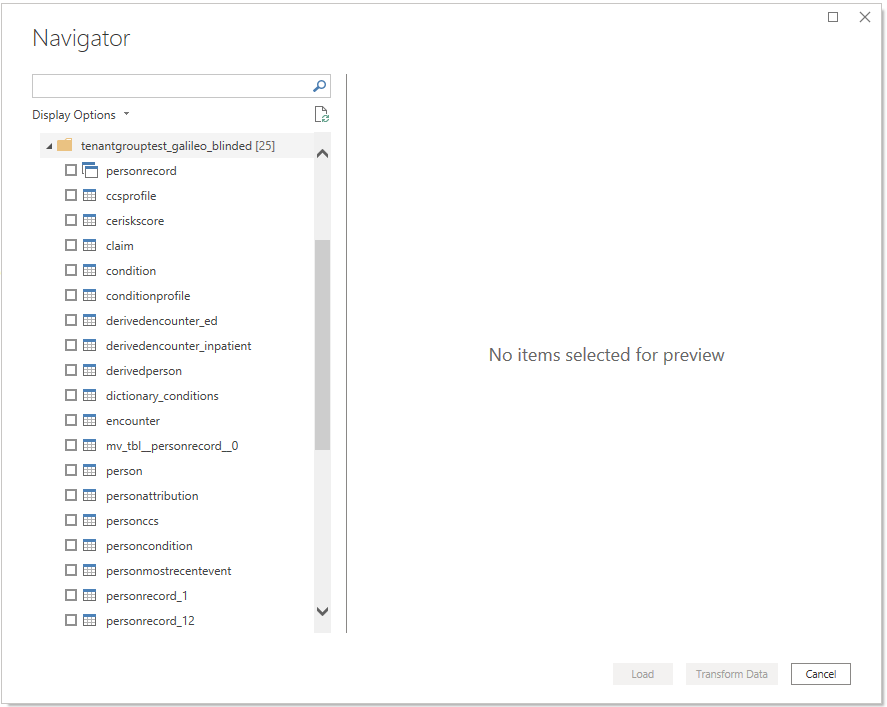
Step 2: Load Tables
Once connected, load tables from the data model in one of your data marts:
Step 3: Build a Visualization
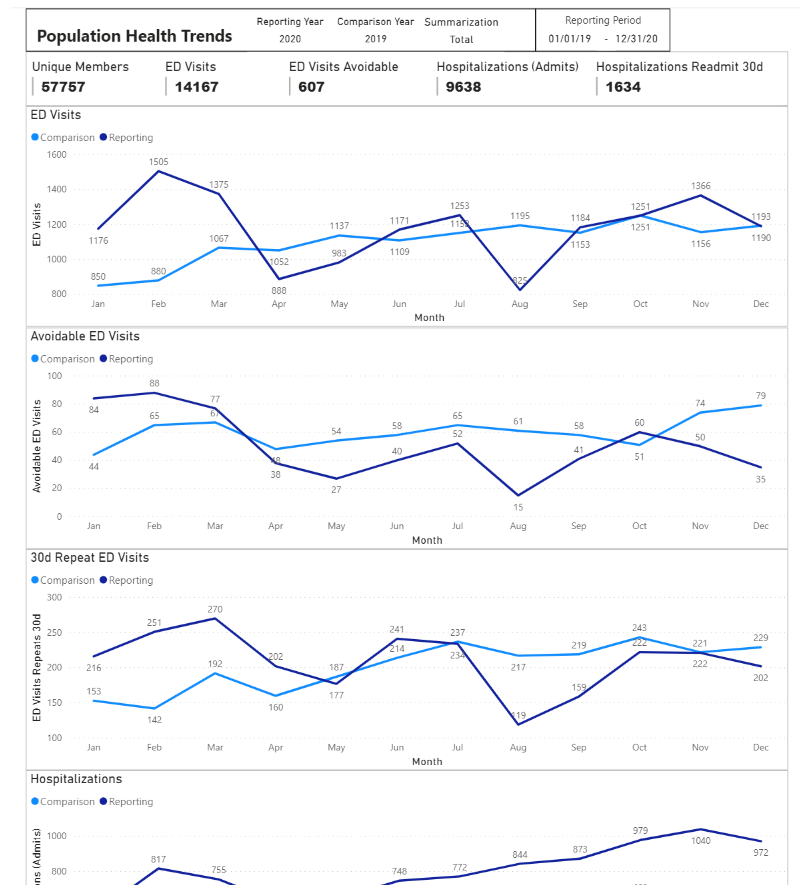
The following dashboard is an illustrative example of a report built with Power BI and using the utilizationperiod table.