Analytics - Tableau
Tableau is an interactive data visualization application that can be used to build reports and dashboards using data concepts available via the Bulk Data API.
Getting Started (Connecting via Redshift)
(Alternatively, you can connect Tableau to a data mart using a Tableau Web Data Connector.)
See also: Tableau’s documentation for Connecting to Amazon Redshift.
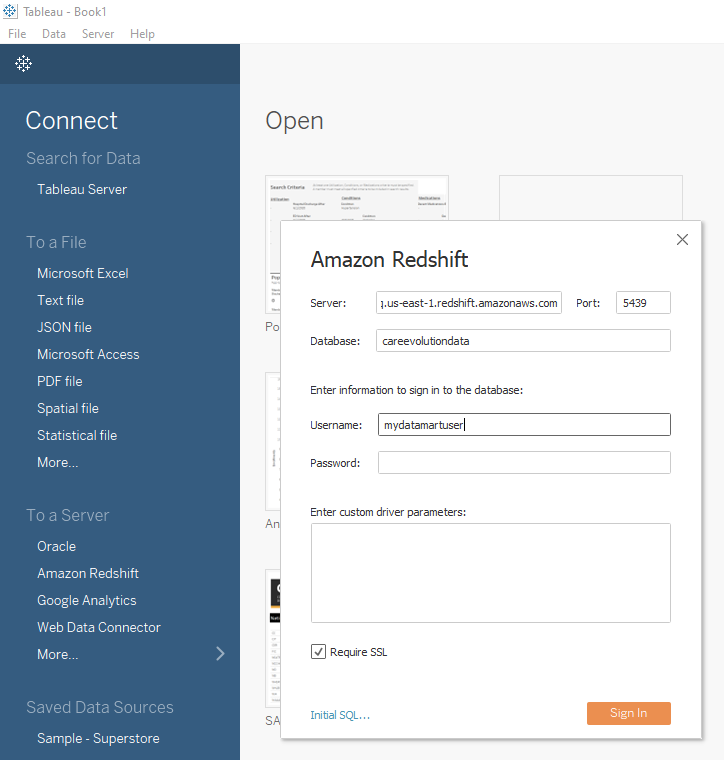
Step 1: Connect to Redshift
Open Tableau Desktop. Create a new data connection using Tableau’s Amazon Redshift connector.
- Server: is the URL or IP address of the Redshift endpoint. This will be included in the connection information you receive from CareEvolution.
- Port: 5439
- Database: This will be included in the connection information you receive from CareEvolution.
- Username and Password: This will be included in the connection information you receive from CareEvolution.
- Custom Driver Parameters: Leave this blank unless your connection information instructs otherwise.
- Require SSL: Must be checked.
- Initial SQL: Leave this blank unless your connection information instructs otherwise.
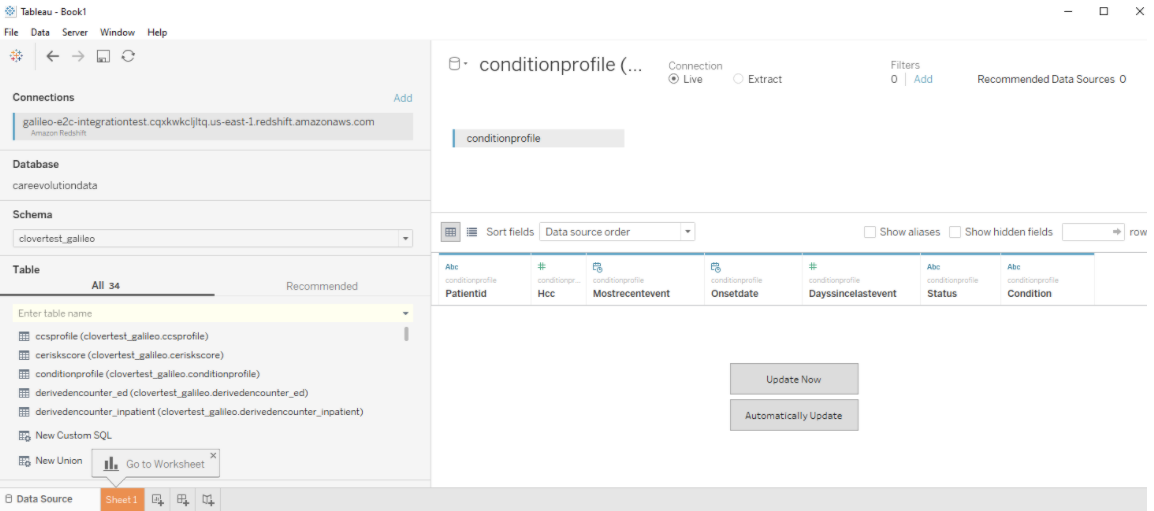
Step 2: Construct a Data Source
Once connected, build a Tableau data source using tables from the data model in one of your data marts:
- Data marts are revealed as schemas in Redshift. Select your data mart from the Schema drop down list.
- After selecting a schema (data mart), you will see a list of tables that are described by the data model documentation.
- Drag and drop tables to construct the data source.
Step 3: Build a Worksheet
Click on a worksheet tab. Use your new Tableau data source to build a visualization.