Data Assets
What data sources have been integrated into HIEBus and are available to the transformations that will be computed in data marts?
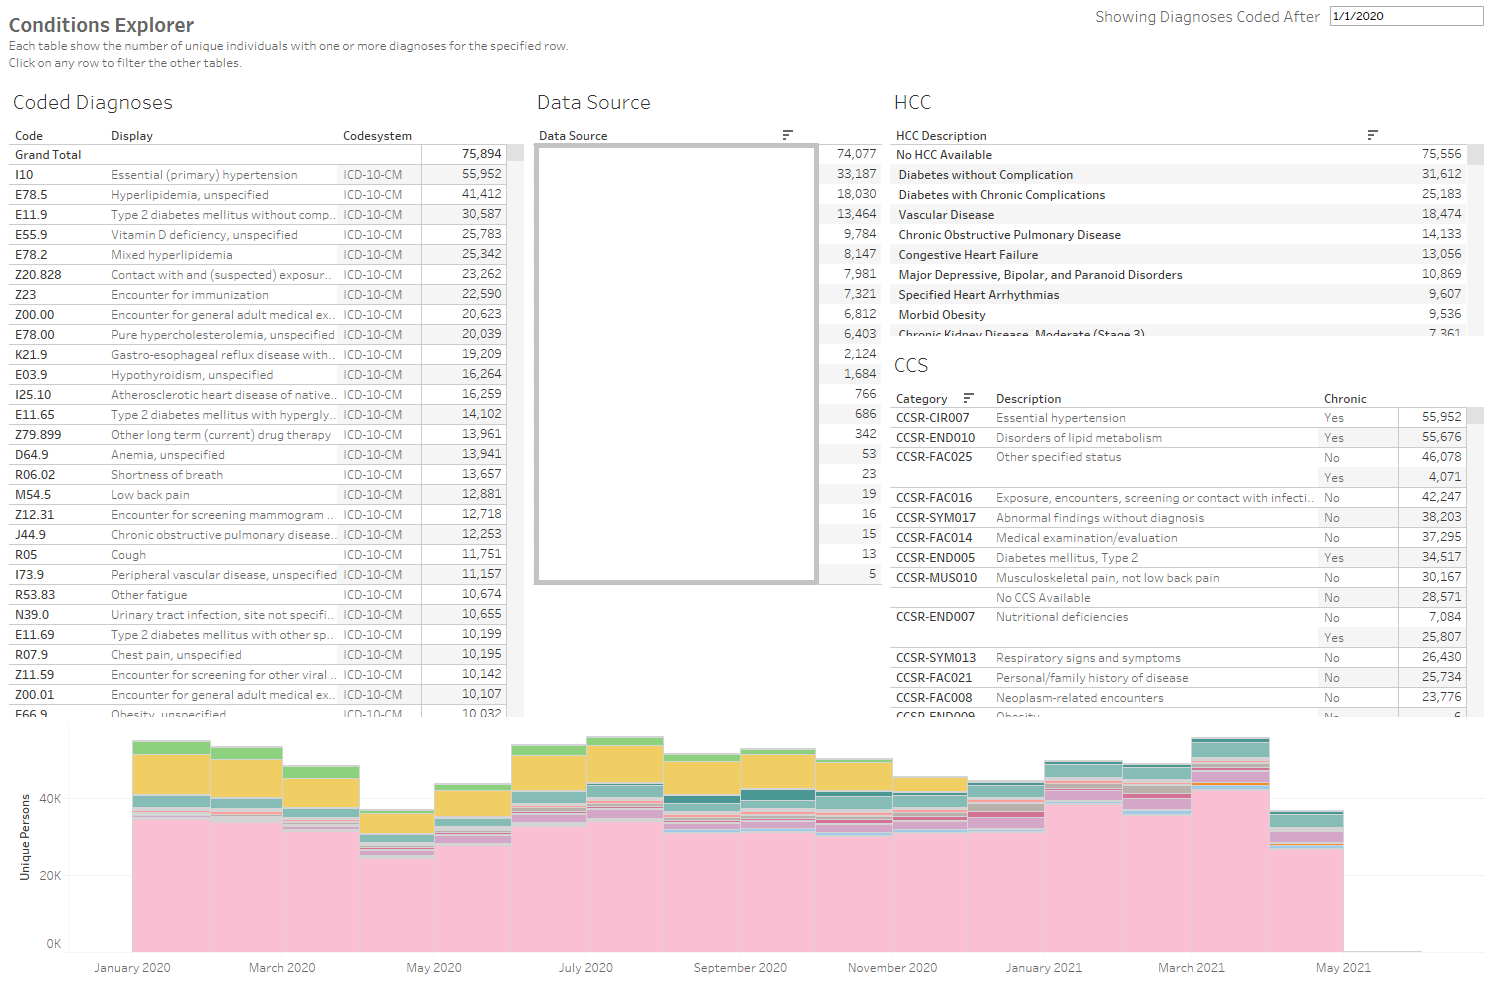
These reports visualize counts of data rows that have been obtained from each data source. These counts are available by data type and monthly period in order to describe the time frame over which useful transformations can be computed.
Key Questions of Interest
- What portion of the overall population is covered by each data source?
- What types of data are available from each data source (labs, orders, problems, procedures, etc.)?
- What time period does the data describe and is the volume changing over time?
Bulk Data API Requirements
Dashboards that address these key questions can leverage the following tables within the Bulk Data API data model:
Example Visualizations (Tableau)
You can view and download this example report on analytics.careevolution.com: Data Overview