Analyzing Clinical Patterns
What is the size and clinical profile of a population defined by clinical rules based on chronic condition, medication therapy, recent acute utilization, and recent labs or procedures?
This Tableau workbook demonstrates a set of common data and analysis patterns that can be used to understand clinical relationships in a subpopulation.
First, value sets are applied to roll up concepts such as conditions (to HCC and CCS) or medications (to ATC classes) in order to interact with these concepts using higher order representations.
Second, a subpopulation can be defined using a complex set of criteria with intersections of ANY, ALL, and NONE logic applied to any clinical concept.
Finally, for the specified subpopulation, visualize the distribution of all clinical concepts (comorbidities, medication therapies, procedures, labs, recent utilization).
Key Questions of Interest
- What is the population size and comorbidities for individuals on a specified medication therapy such as a diuretic, antihypertensive, or oral hypoglycemic?
- What is the population size and percentage of individuals with CHF that were recently discharged from a hospital without PCP follow up?
- What medication therapies are commonly used for individuals with COPD, hypertension, diabetes, or some combination of these conditions?
- What percentage of each disease registry is missing a recommended medication therapy?
- How many hypertensives are using a combination medication therapy?
- What are the most common beta blockers prescribed for individuals with additional comorbidities?
Bulk Data API Requirements
Dashboards that address these key questions can leverage the following tables within the Bulk Data API data model:
Example Visualizations (Tableau)
You can view and download this example report on analytics.careevolution.com: Population Health Explorer.
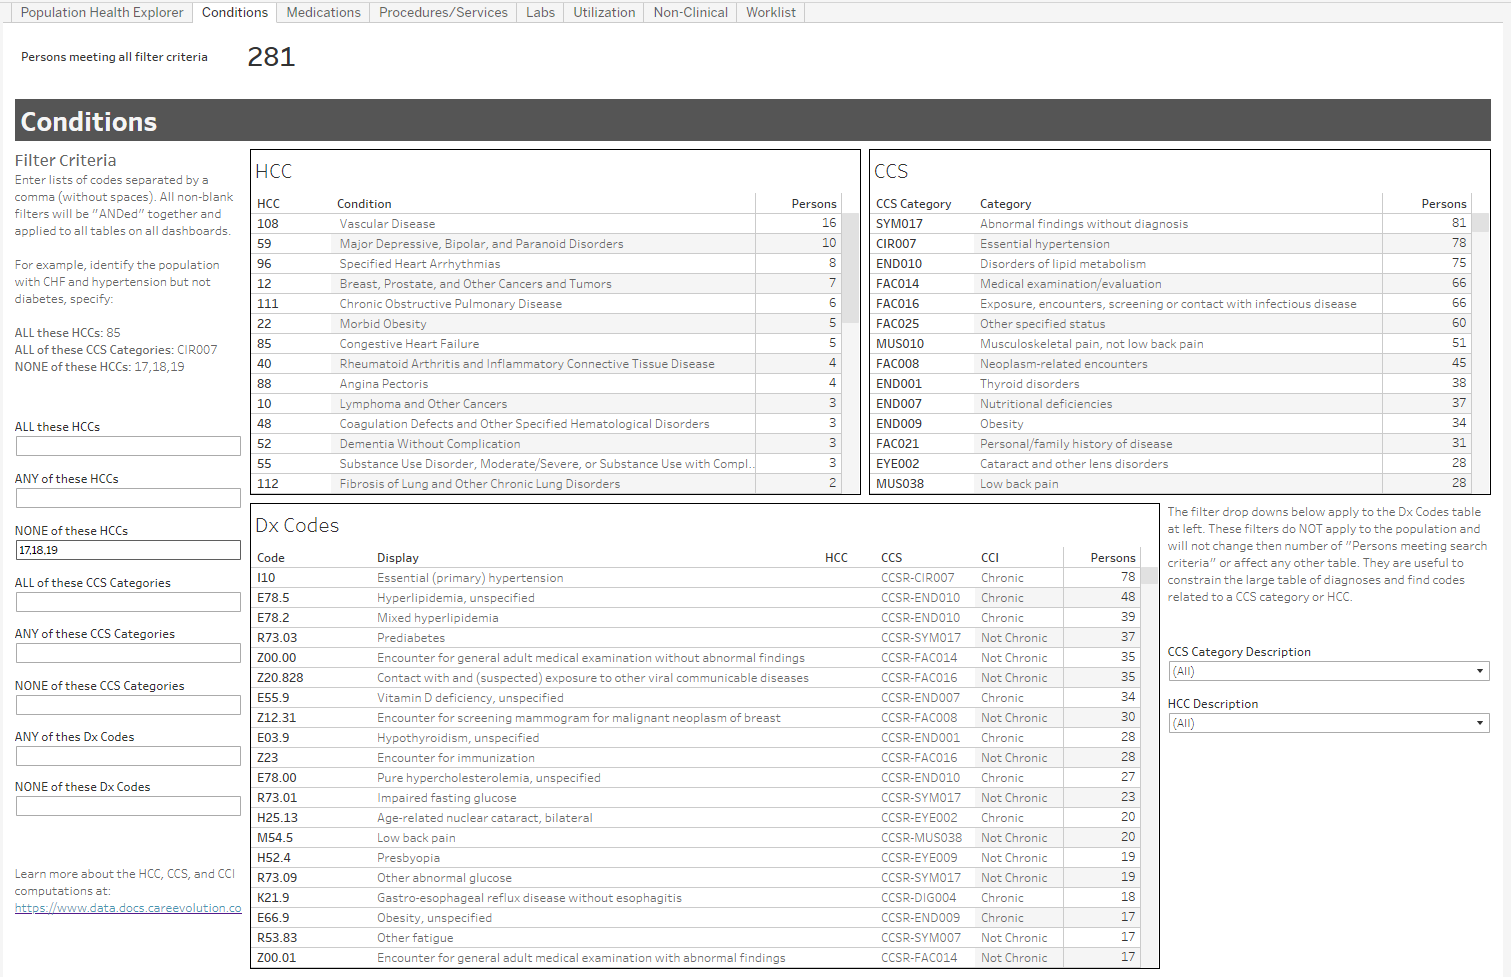
Image 1: Population size and comorbidities (by HCC, CCS category, and ICD10 code related to heart failure) for individuals with CHF and hypertension, but not diabetes.
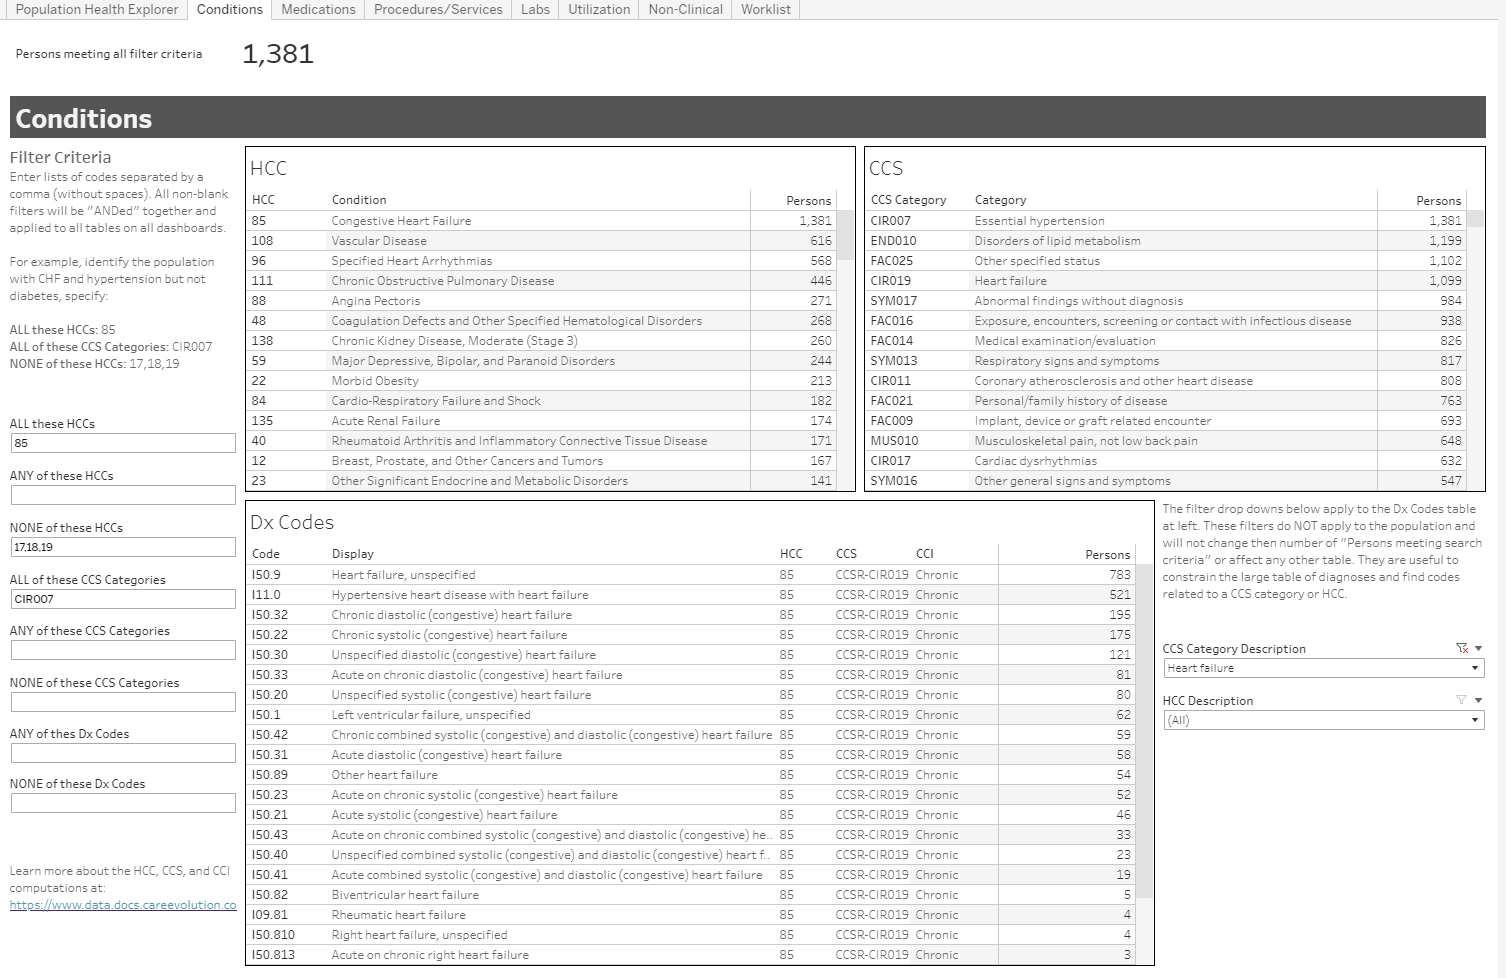
Image 2: Diuretic-related medication therapies for the individuals in the above population (CHF and hypertension, but not diabetes).
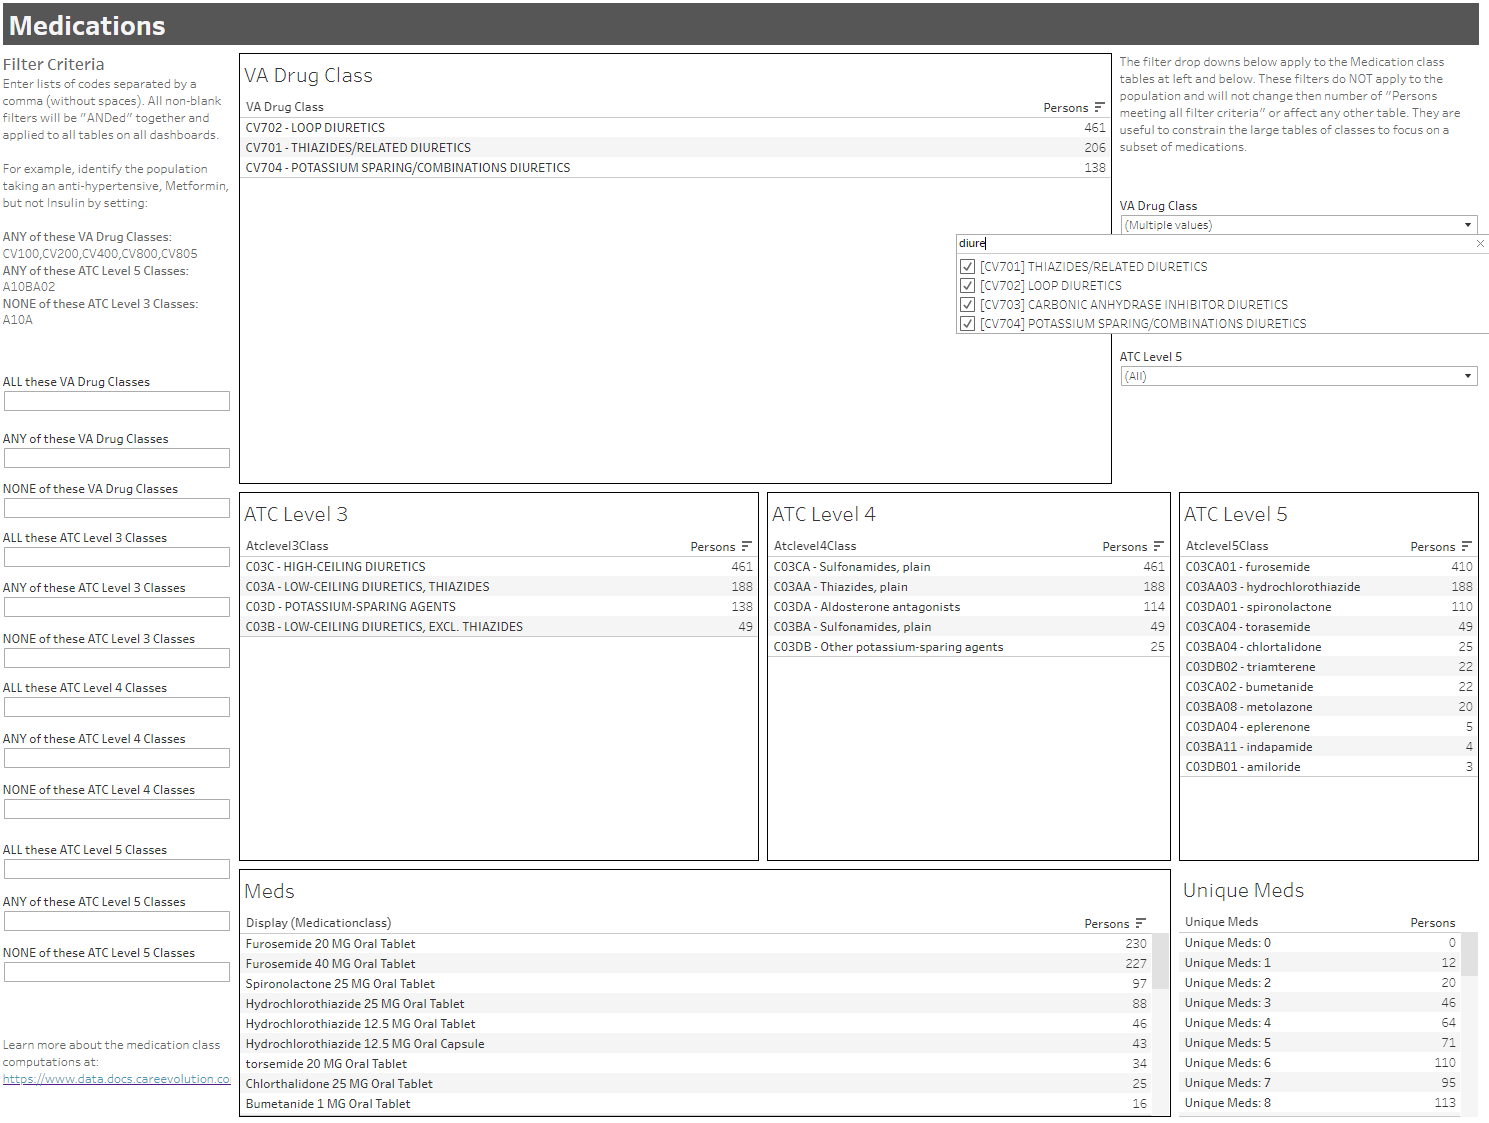
Image 3: Acute utilization for the individuals in the above population (CHF and hypertension, but not diabetes).
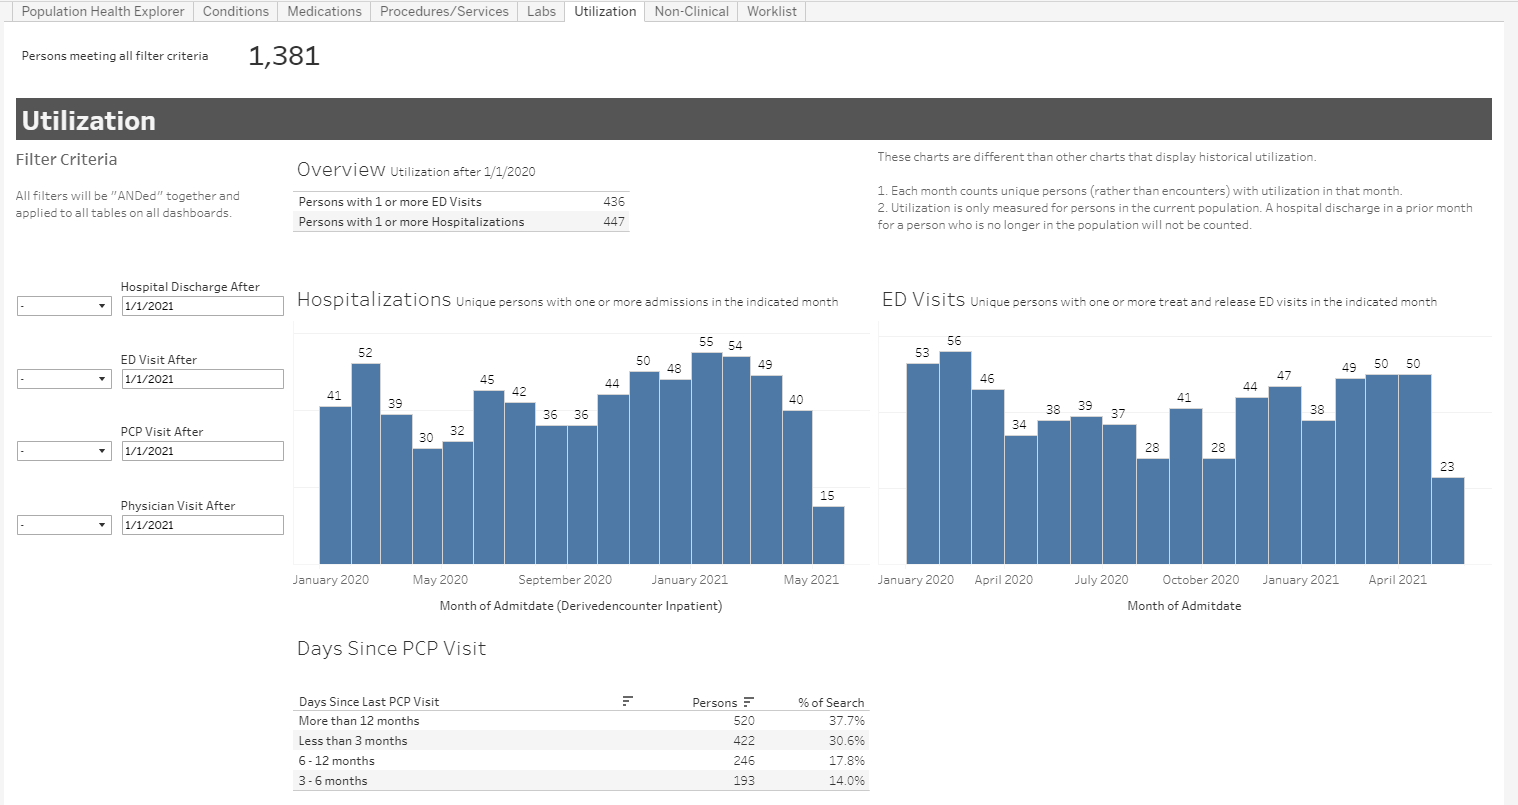
Image 4: Population size and comorbidities (by HCC, CCS category) for individuals taking metformin but not coded with diabetes.